Learn to Read Science, Part 2: CATIE Continued
More didactics in the form of memes
In part one of this article, we introduced the CATIE, a landmark trial (purportedly) about antipsychotic effectiveness. This article isn't actually about antipsychotics; it's about how to read science in the first place. Welcome to The Frontier Psychiatrists. There is a paywall, but you can share the newsletter to get access for free.
In summary, we looked at which journal the article was published in, which was a big deal. We looked at the abstract together and then started dissecting the methods section. We did a thorough review of Table One, which tells you who is in a study.
This article will focus on results and how to interpret them. Many people worry about whether they will be able to “understand the statistics.” Given the unclear manner in which many articles are written1, this is a fair thing to worry about.
I argue this is not because you're bad at “understanding statistics.” Instead, scientists are sub-optimal communicators. We often create misleading tables, too!
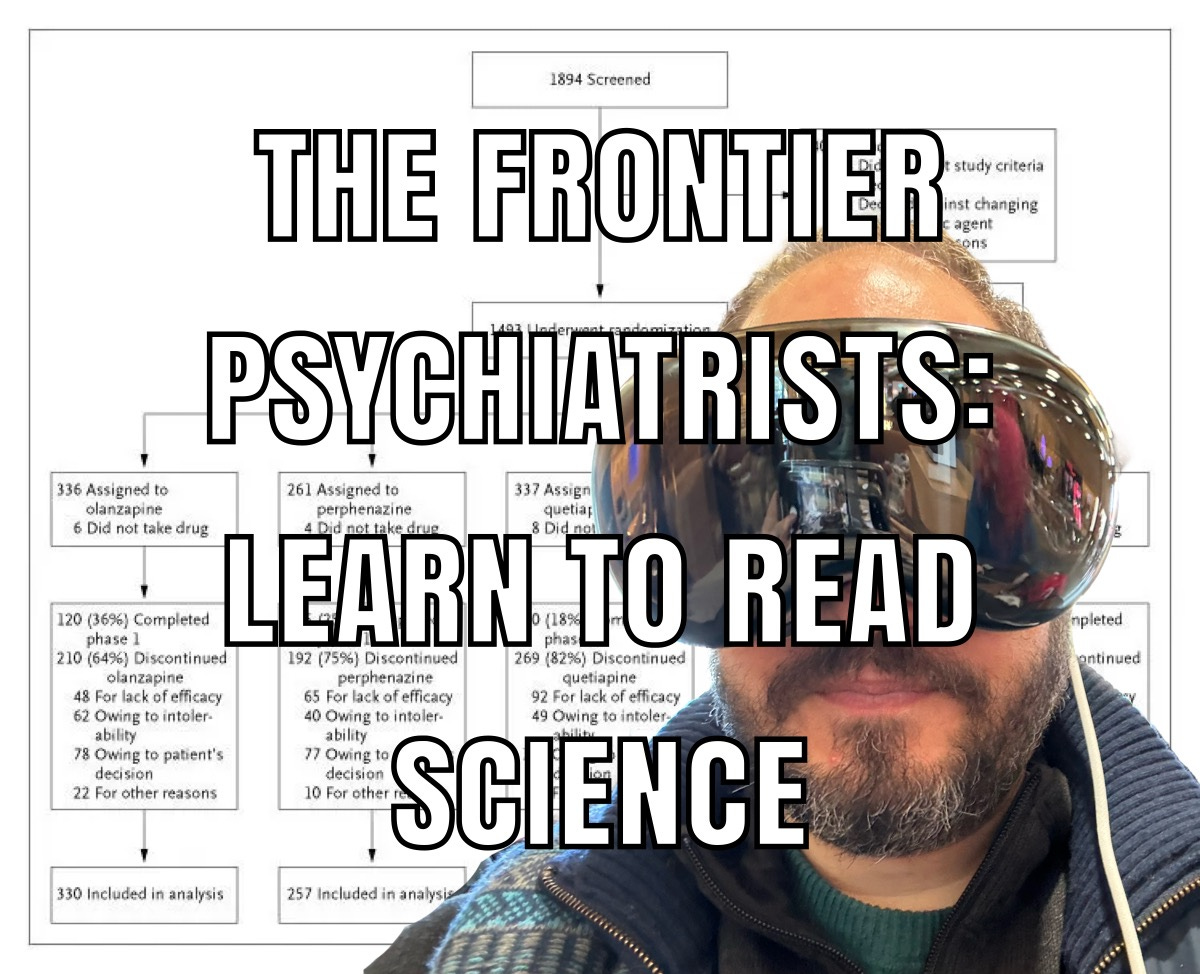
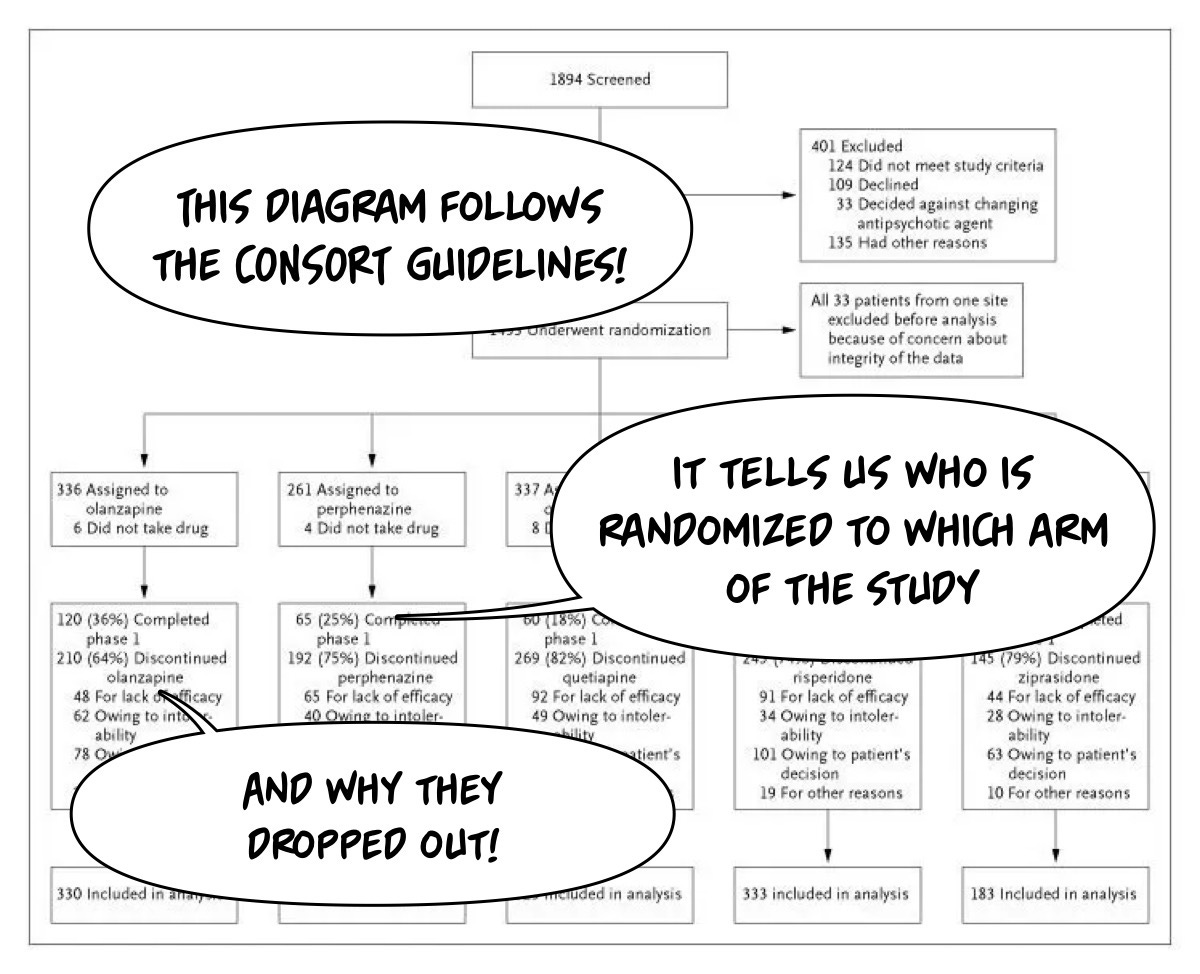
Conveniently, there is a standardized format for reporting clinical trials, called the CONSORT Standard (consolidated standard of reporting trials). Most articles should follow the same format! Yes, I know, you're welcome.
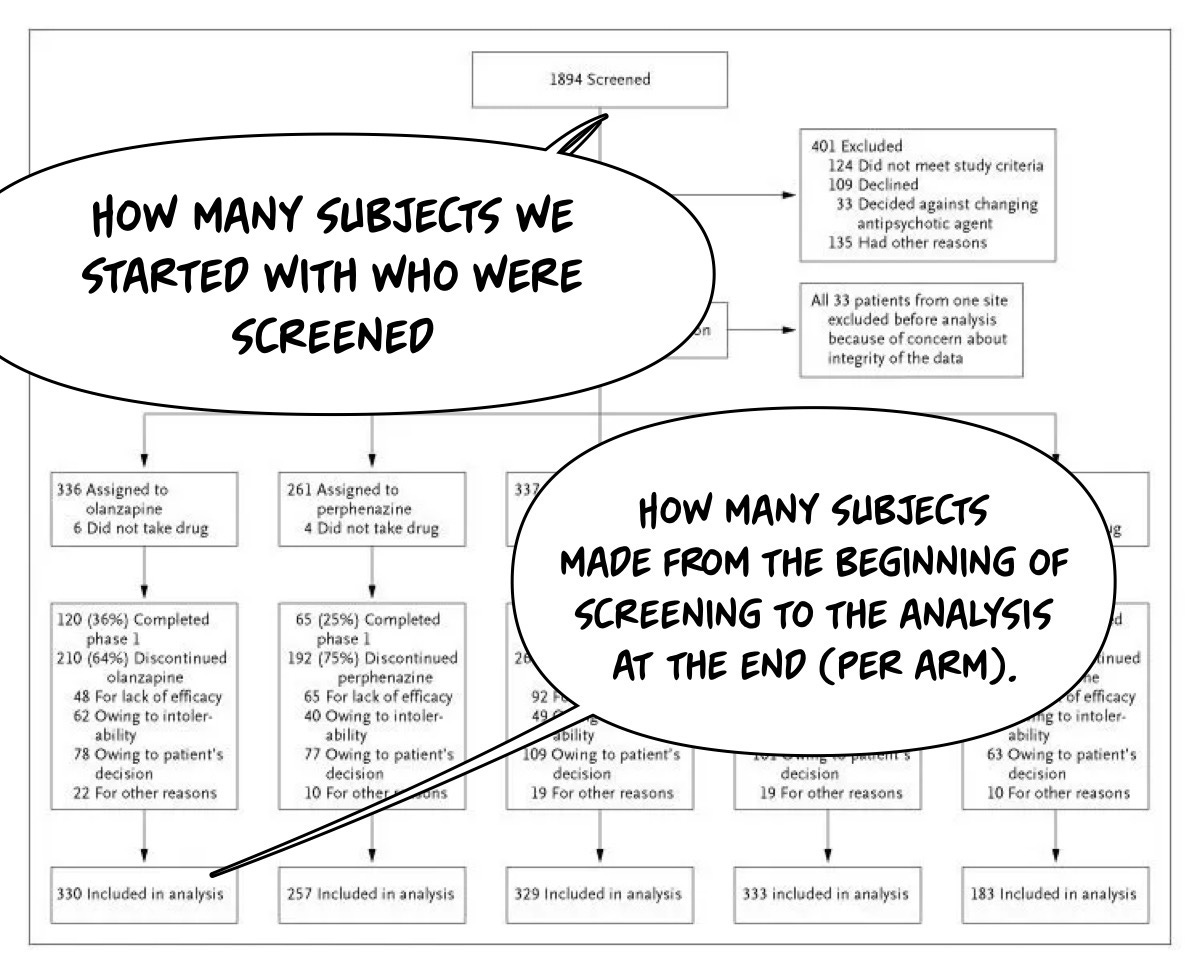
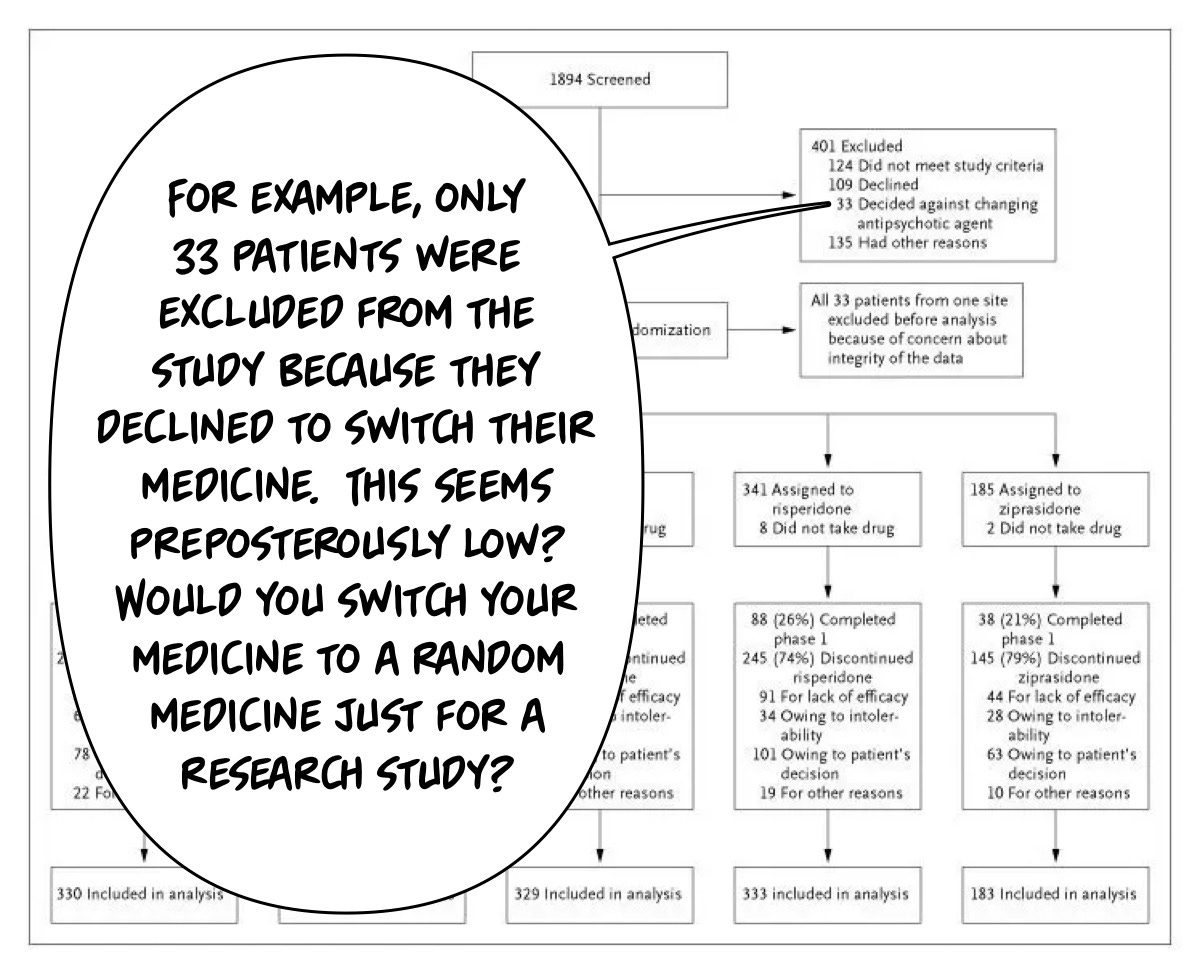
The New England Journal of Medicine has more scrutiny around table formatting and figure formatting than most journals, making this journal, particularly this article, worth reviewing for practice. Let us look at this initial diagram for what we need to understand!
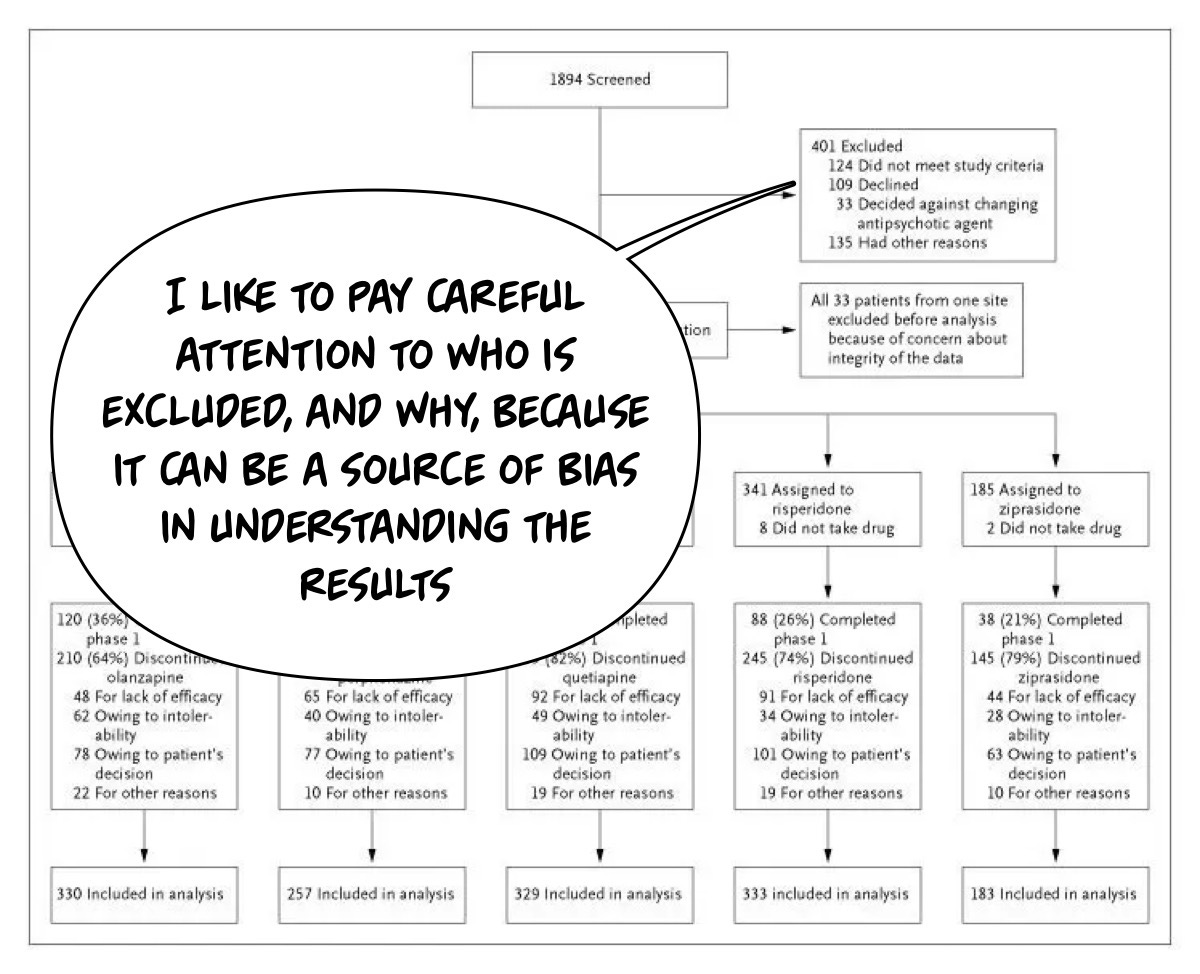
We want to know who is in the trial and who was screened out to help us calibrate our sense of what bias may prevent our ability to generalize the findings from only applying to the individuals in the study to “other patients.” I would like to start by looking at who was screened in and who was excluded:
I compare what I know (or can find out) about what is true in the general population vs what is true in the study. Here, I’m using some common sense and some ability to “google it” if there is a base rate I am not familiar with. Looking at this CONSORT diagram, we will notice something slightly odd…
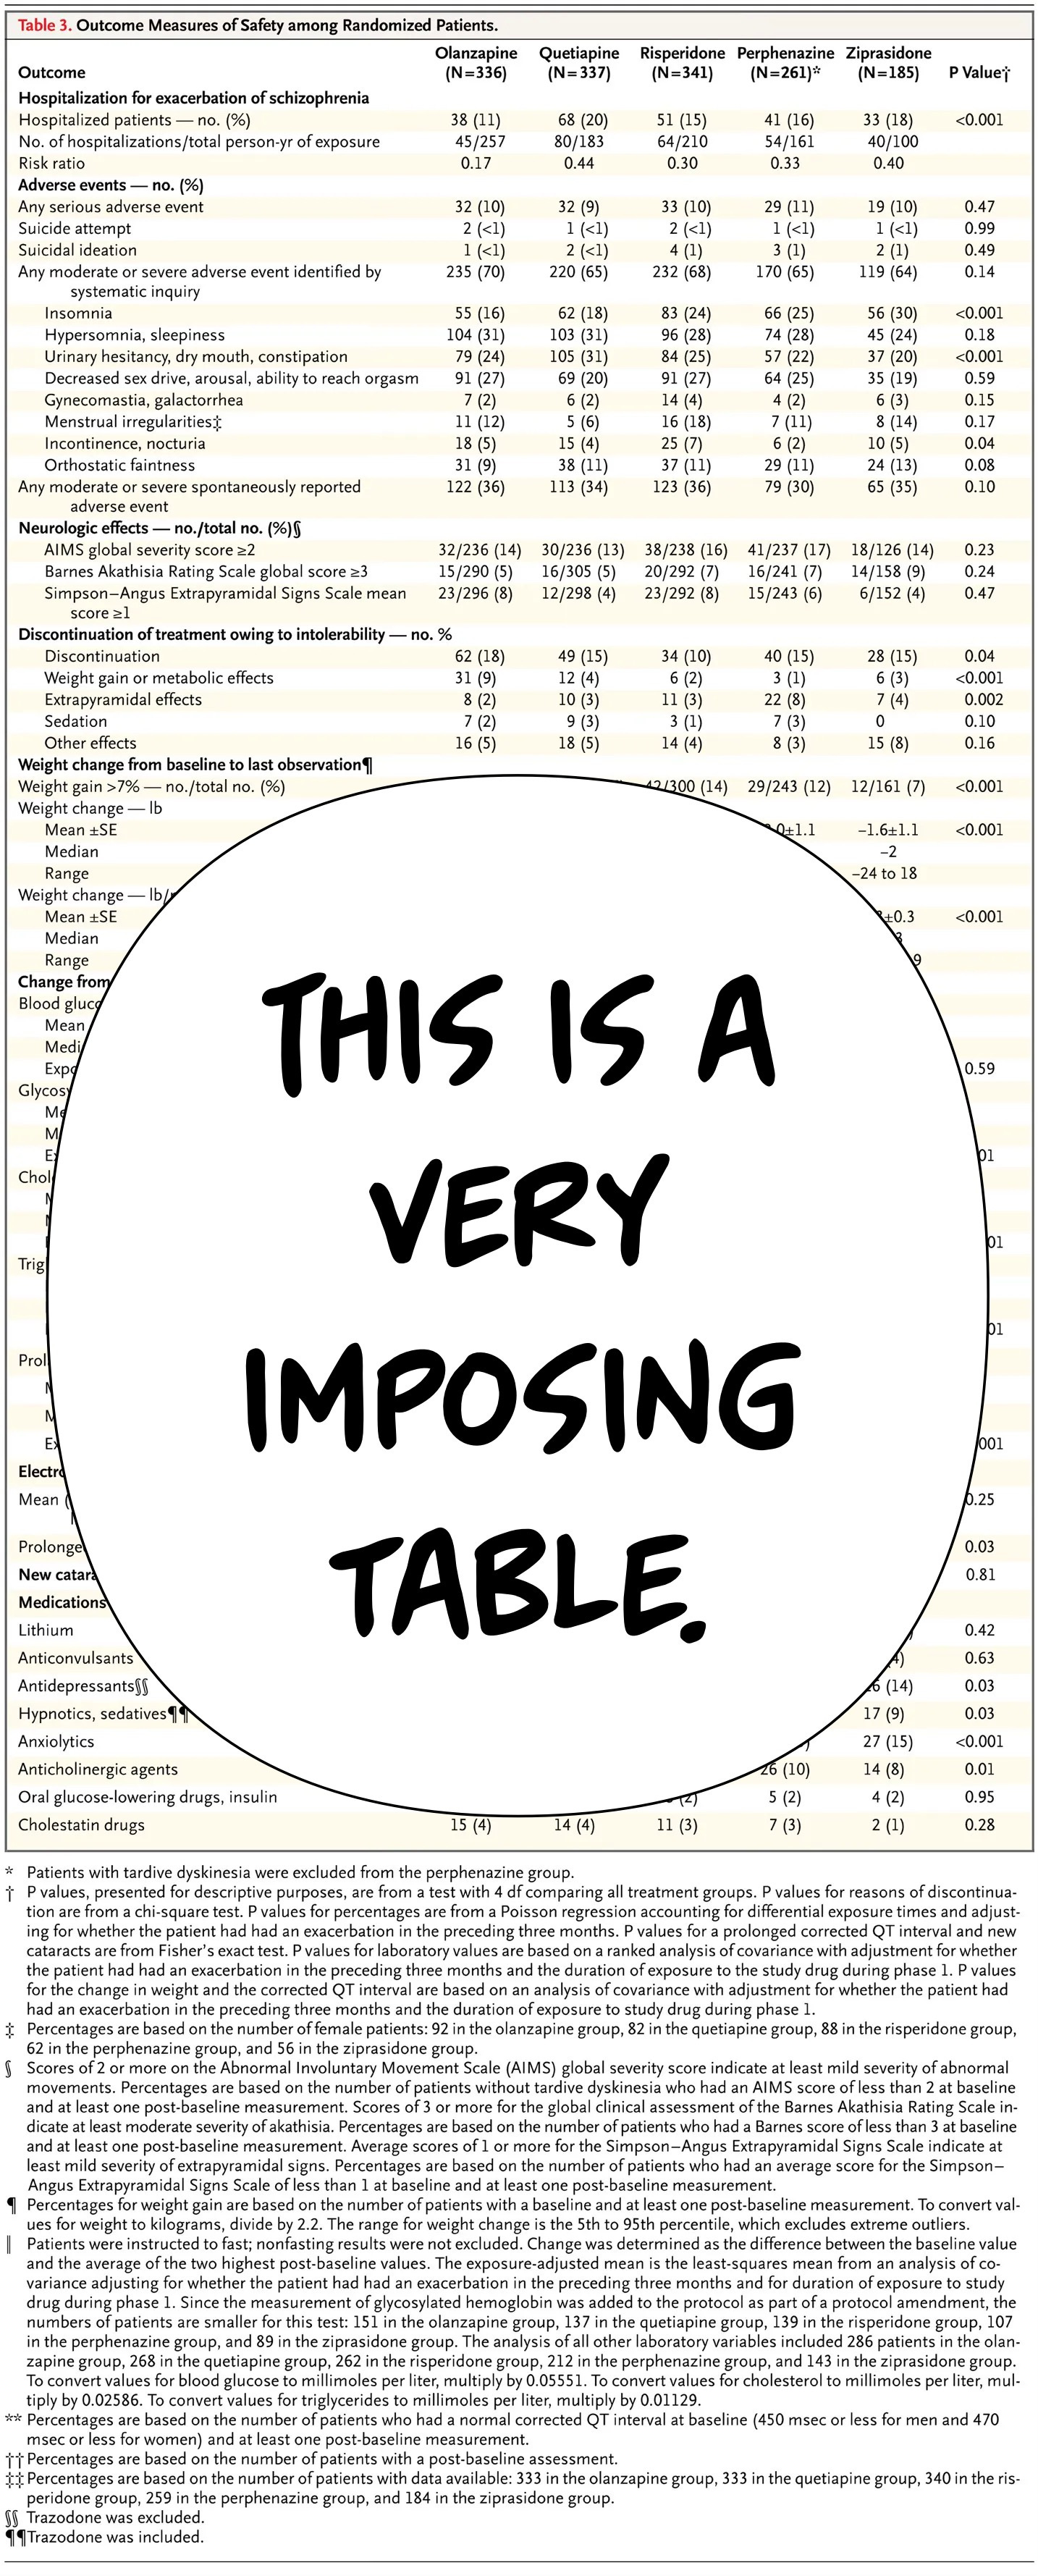
We won’t bother going line by line through that, but feel free to do so on your own to get some practice! We will move on to the outcomes of the trial and safety, which are reported in Table 3:
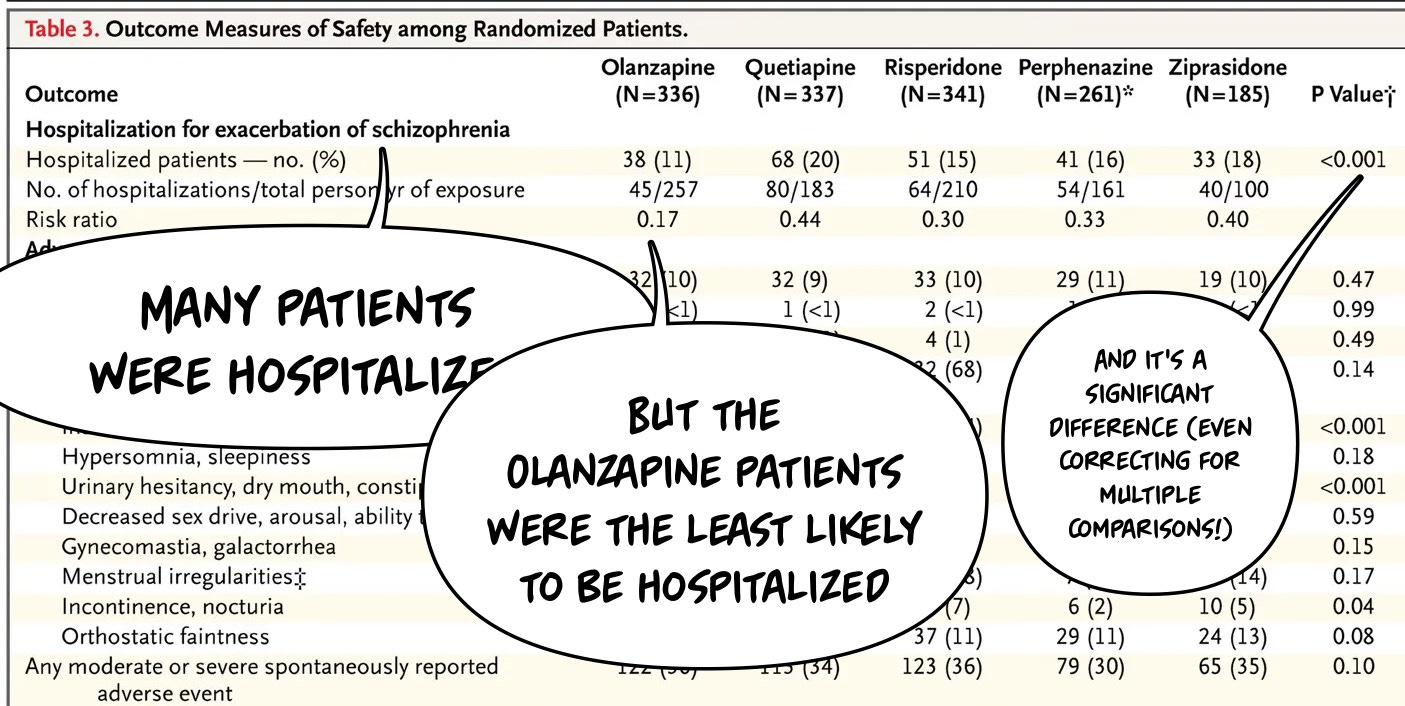
That is a lot. Like, a lot, a lot. It is tempting to run away from a table like that as a junior scientist or casual reader. However, I will take this apart bit by bit and make (I hope!) my thought process straightforward, starting with hospitalization data.
Keep in mind although this is a randomized trial of antipsychotic medicines, we know from our evaluation in part one that, in reality, patients taking a medicine were randomized to a switch. This makes the results a little bit messier. Olanzapine might be a medicine that keeps people out of the hospital more…or it may be that since more patients were taking olanzapine at baseline, some of those who were randomized to the medicine were taking it already and thus not switched. So, one might argue that this lower hospitalization finding might actually favor not having a stable medication switched. We can’t answer the question definitively based on this study design, which is part of the trade-off in all large-scale research.
Not all questions can be addressed, and not all questions are easy—or ethical—to address.
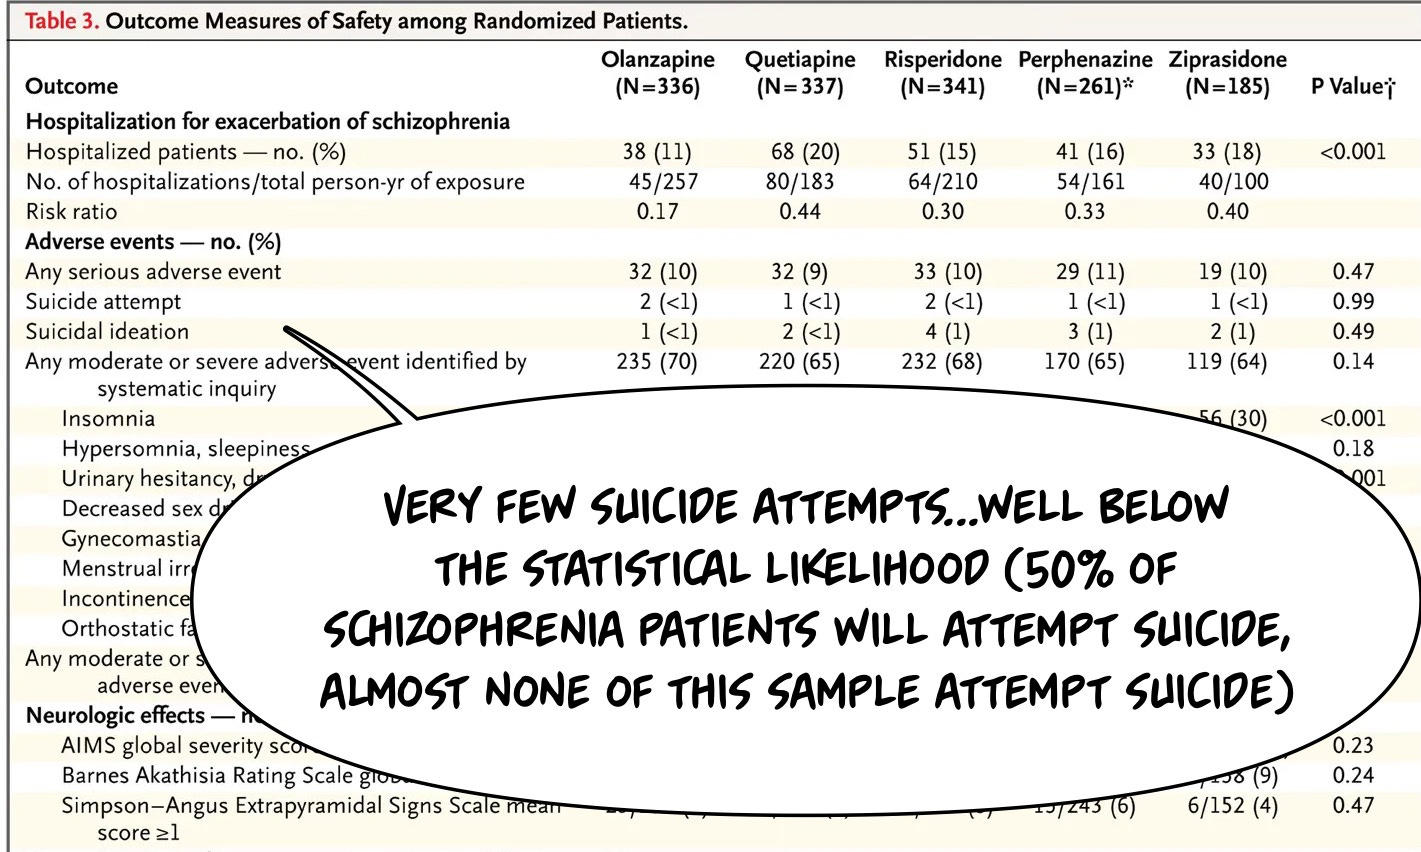
For example, suicide attempts or completions are notoriously difficult to address in research. Here, we can see that highly suicidal patients were likely screened out of the study in the first place…given the rates of suicide attempts in the sample are vastly lower than one might expect from the population at baseline2.
This expectation on my part has evidence, and again, please look at the vertical line! An odds ratio of One is the far left, which makes this midpoint for the reported meta-analysis NOT equipoise (OR =1) as I described the other day…which is why standard ways of reporting data like CONSORT matter…regardless, is what a large meta-analysis of suicide risk in individuals which psychosis demonstrates:
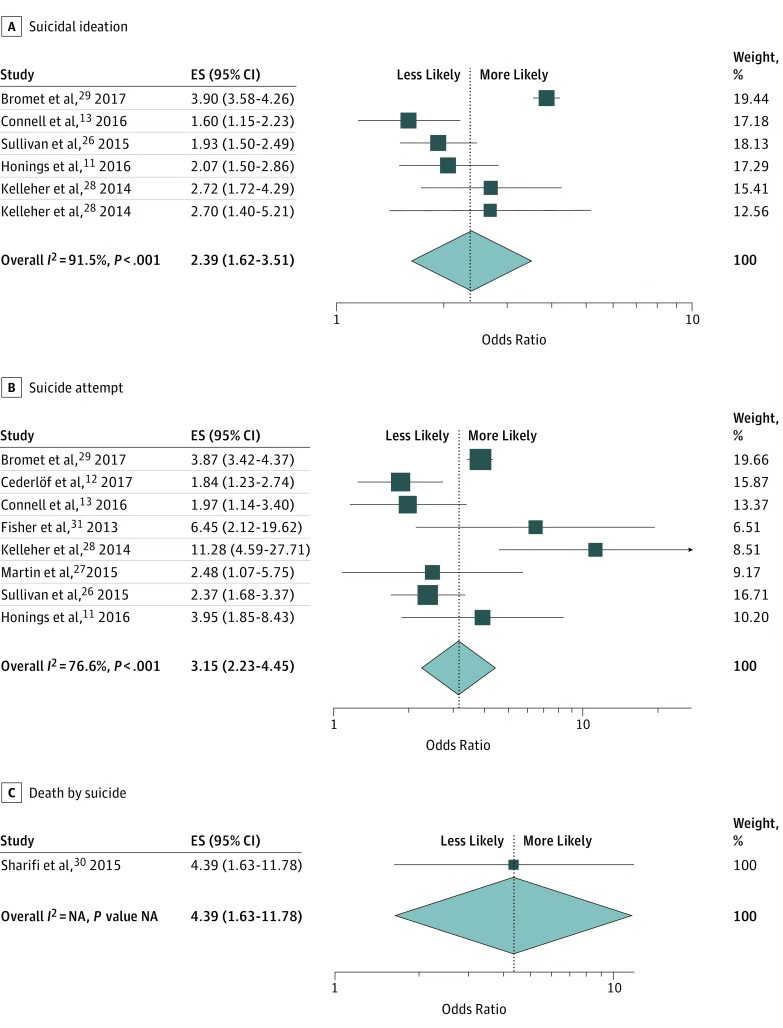
People with psychosis are more likely to think about, attempt, and die by suicide. The CATIE trial includes fewer attempts than would be expected by chance in a population of individuals with psychosis.
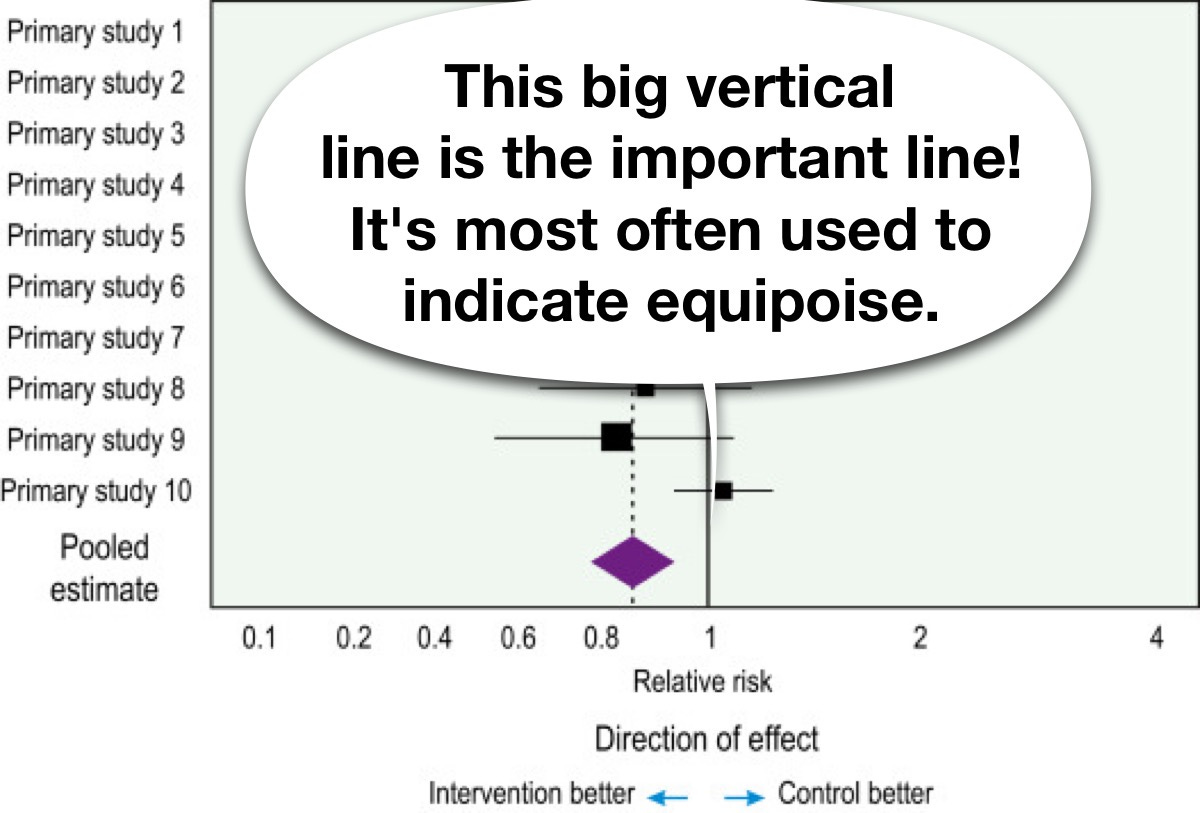
This is a bad forest plot…recall from my prior article on the topic it's supposed to look like this:
I redid the graphic in keeping with a clearer graph-making:
Keep reading with a 7-day free trial
Subscribe to The Frontier Psychiatrists to keep reading this post and get 7 days of free access to the full post archives.


